Jordan Schwarz · 1 October 2026
Mapping Global Fuel Price Variations Using Aviation Industry Reports
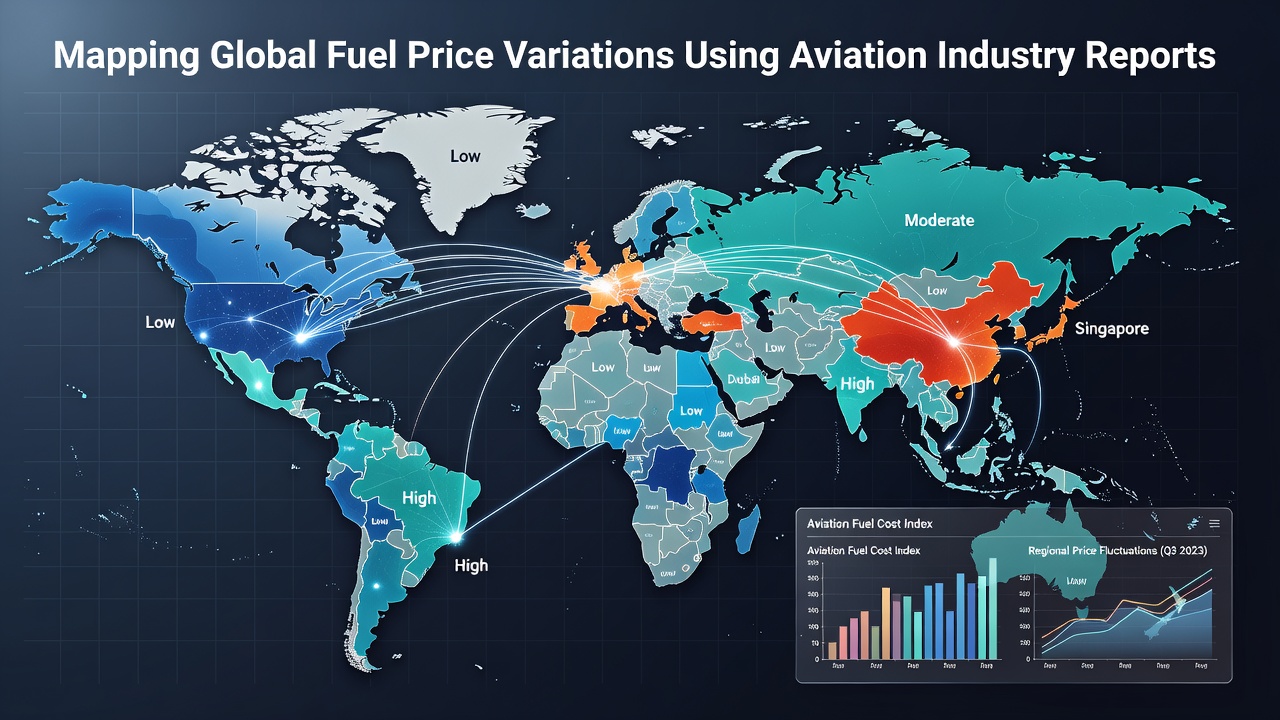
Global aviation fuel prices fluctuate based on crude oil benchmarks, regional refining capacity, tax structures, and supply logistics, and industry reports provide the raw data needed to track these shifts over time. Researchers compile figures from airline filings, fuel supplier invoices, and regulatory submissions to build layered maps that reveal price differentials between major hubs such as Singapore, Amsterdam, and Los Angeles. Data sets released in October 2026 continue to show that jet fuel in Asia-Pacific corridors trades at narrower margins above crude compared with European locations where carbon levies add measurable premiums.
Data Sources That Enable Precise Mapping
Aviation industry reports aggregate daily and weekly fuel price observations from airport fueling operations, carrier purchase contracts, and spot market transactions. Organizations like the International Civil Aviation Organization publish standardized tables that list average jet fuel costs by region, while national bodies such as the U.S. Energy Information Administration release weekly rack prices at key distribution points. These sources feed into geographic information systems that convert tabular numbers into color-coded maps, allowing analysts to identify corridors where prices diverge sharply from global averages.
Additional granularity comes from airline quarterly filings that disclose fuel costs per available seat kilometer along specific routes. When these figures are cross-referenced with port-level delivery data, patterns emerge around seasonal demand spikes and refinery maintenance schedules. Observers note that combining multiple report streams reduces gaps that single-source data often leave in remote or low-traffic airports.
Regional Price Differentials Revealed by Recent Reports
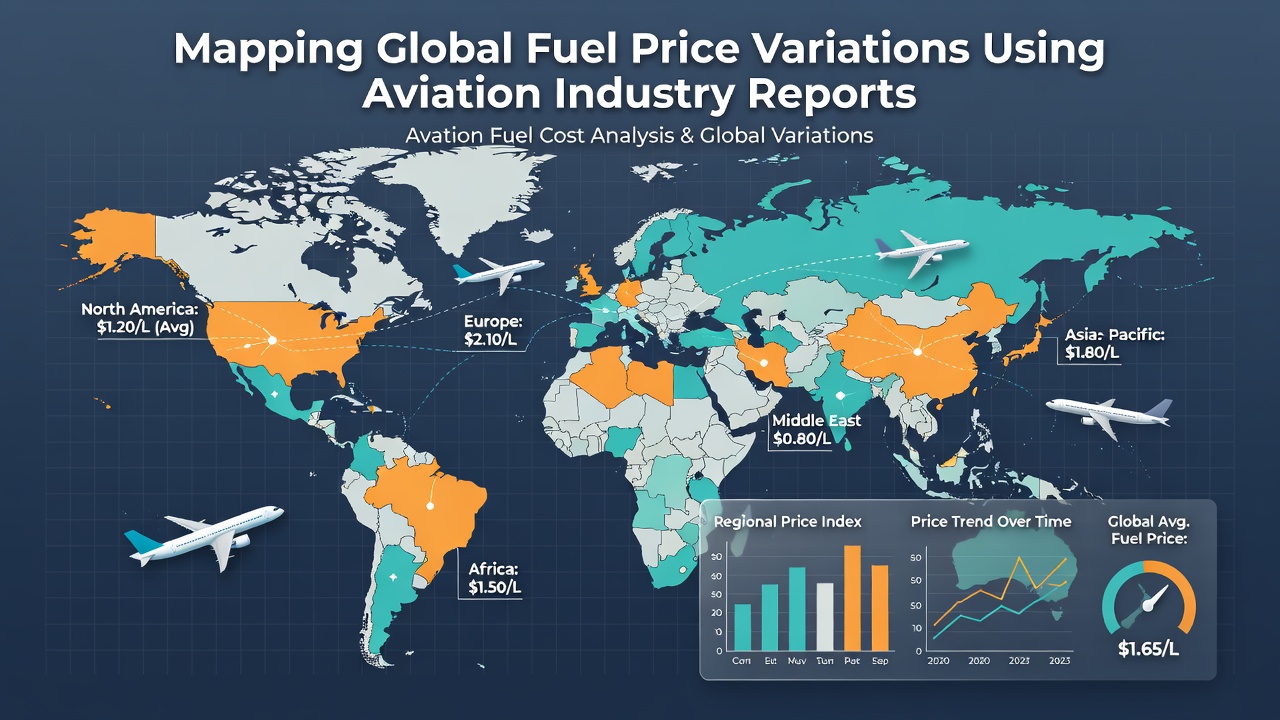
Reports covering the third quarter of 2026 indicate that North American jet fuel averaged 18 percent below the European equivalent after accounting for currency conversion. Middle Eastern hubs continued to post the lowest absolute prices, reflecting proximity to crude production and lower regulatory overhead. In contrast, island nations in the Pacific recorded premiums driven by longer tanker routes and limited storage infrastructure. Maps constructed from these numbers highlight a consistent east-west gradient across the Atlantic, where transoceanic flights encounter price steps at each refueling stop.
European data sets further separate pre-tax fuel costs from environmental surcharges, showing that the latter component accounts for roughly one-third of the final delivered price at major gateways. Australian and Canadian regulatory releases provide comparable breakdowns, confirming that distance from refining centers and currency movements explain most remaining variation once taxes are removed.
Methods for Converting Reports into Visual Maps
Analysts import report tables into spatial databases, then apply interpolation algorithms to estimate prices at airports lacking direct observations. They calibrate these estimates against actual carrier invoices obtained through industry associations. The resulting surfaces update monthly, producing time-series animations that illustrate how price shocks propagate along major flight corridors. Software tools allow users to overlay weather disruptions, geopolitical events, and refinery outages to test causal hypotheses against observed price movements.
Validation steps include back-testing mapped values against independent spot prices published by Platts and other energy information providers. Discrepancies trigger review of underlying report assumptions, such as contract versus spot purchase mixes. This iterative process improves accuracy for subsequent mapping cycles and supports scenario modeling for future fuel cost projections.
Applications in Route Planning and Cost Forecasting
Carriers use mapped price surfaces to optimize fuel uplift decisions, choosing to tanker fuel from lower-cost locations when payload and range permit. Network planners incorporate these maps into simulation models that evaluate new route profitability under different fuel price scenarios. Finance teams rely on the same visualizations when hedging programs require allocation of protection across multiple currency and commodity exposures.
Airport authorities examine the maps to assess competitiveness of their fueling facilities relative to nearby alternatives. Data showing sustained premiums can prompt investment in storage expansion or pipeline connections that reduce delivery costs. Government agencies similarly reference the visualizations when evaluating tax or subsidy policies intended to stabilize domestic aviation markets.
Conclusion
Aviation industry reports supply the consistent, geographically tagged data required to construct reliable maps of global fuel price variations. When these reports are integrated into spatial analysis platforms, clear regional patterns become visible and support operational and policy decisions. Continued publication of standardized figures through October 2026 and beyond will allow the mapping process to track evolving market conditions with increasing precision.